The performance-based navigation (PBN) concept specifies that aircraft RNAV and RNP system performance requirements be defined in terms of the accuracy, integrity, continuity, and functionality, which are needed for the proposed operations in the context of a particular airspace concept, (ICAO Doc 9613 Performance-based Navigation (PBN) Manual). The implementation of PBN is gaining acceptance worldwide and is seen as a solution to some of the airspace congestion issues that face many countries. In support of a recent project, we challenged our Aviation Consultant Isaac Warsame to find a way to test the navigational accuracy element of flights on the first element of an RNP1 SID, from runway take-off to a fly-over waypoint, ~3NM ahead.
Overview the Analysis Task
The analysis was undertaken with the aim of ascertaining statistical evidence that supports the hypothesis that aircraft can, within a certain degree of error, accurately follow a predefined track to a set fly-over waypoint.
The analysis utilised ADS-B data from Melbourne Airport (YMML). More specifically, it scrutinised flights departing runway 16 tracking to the fly-over waypoint HORSH following the RNP1 SID.
Before any statistical analysis could take place, we needed to select and clean our data. The ADS-B trajectory data in its raw form contains thousands of different flights with millions of data points. In choosing a specific set of flights, several constraints were required to be adhered to.
- The timing of the flight had to be within 0600 and 2300.
- This constraint is put in place as flights are more likely to follow the SID to waypoint HORSH during the chosen times. We found that at night SIDs are often cancelled and radar departures are used in lieu.
- The flights chosen must be departing on runway 16.
- As we are analysing flights utilising runway 16 to waypoint HORSH, we only require flights departing YMML runway 16.
- Altitude (ft) of between 100ft and 6000ft.
- This constraint is put in place to firstly create a cut off so that only flights that are airborne and not still on the taxiway are targeted. Secondly, we only want flights up to 6000ft as beyond that the data becomes obsolete.
- Latitude & Longitude constraints
- This constraint creates a geofence so that only flights departing the runway are collected rather than overhead flights or flights from Essendon.
- Filtered for Jet only aircraft.
- The ADS-B data contains flights from various different types of aircraft. As the SID to the waypoint HORSH is limited to only jet aircraft, all other types of aircraft (e.g., turboprop) must be filtered out.
Cleaning steps that took place post filtering included normalisation, and the removal of flights that were less than 30 seconds, or more than 60 seconds and with less than 30 data points. To normalise the data, we grouped all the entries that occurred in a second and calculated the mean for the altitude and the latitude and longitude. This resulted in a cleaned dataset with 28,176 flights; enough data to provide a representation of the flights, and without outliers and noise in the data.
Statistical Analysis
Descriptive Statistics were the main statistical analysis tool employed. Graphical tools were also utilised to show the results of the data analysis in addition to histograms, scatterplots, line plots and mapping.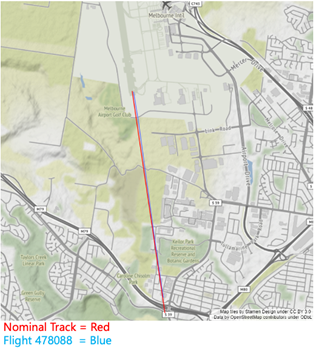
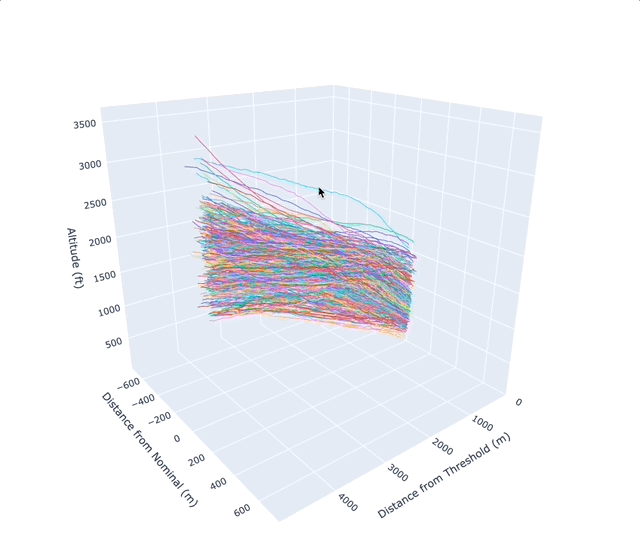
The main analysis calculated the amount of lateral deviation in the flight path compared to the nominal track. For each flight, a geodesic algorithm, that takes into consideration the ellipsoidal shape of the earth, was employed to calculate the distance between the Nominal Track and the Flight Track. The bearing of the coordinate point was utilised to calculate either negative or positive skew. In addition, we were also able to ascertain the vertical profile of flights which aided in the creation of a 3D visual graph. From this, using visual inspection we could e.g., clearly see the different performance profiles of varying aircraft, e.g., an A380 vs B737.
Results
Of the 28,176 flights analysed
- The Mean lateral deviation from the nominal track was found to be 16.62m (0.00898 NM)
- This value is essentially denoting that out of the ≈ 28,000 flights that took place, they average 16.62 m in deviation from the nominal track.
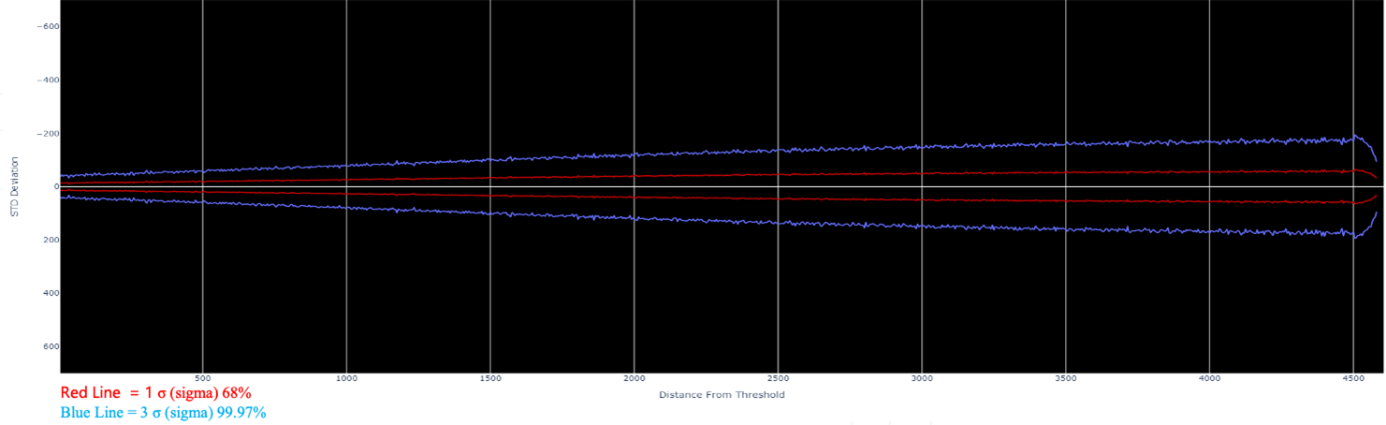
- The Standard Deviation was 42.03m.
- With this figure we can confirm that 99.97% of the values fall within ±126.09m (±0.0681NM)
- As it is much larger than the mean, it shows that the data is spread out over a wider range of values.
- The East & West maximum values are shown respectively as 350.82 m and 436.64 m.
- However, we must consider the outlier removal process and thus it can be concluded that these figures are likely higher when unfiltered due to the presence of outliers.
- The 75% of the values lie within 29.91m which is less than the wingspan of a B737.
Note: A very low number of extreme outliers were removed in the filtering process.
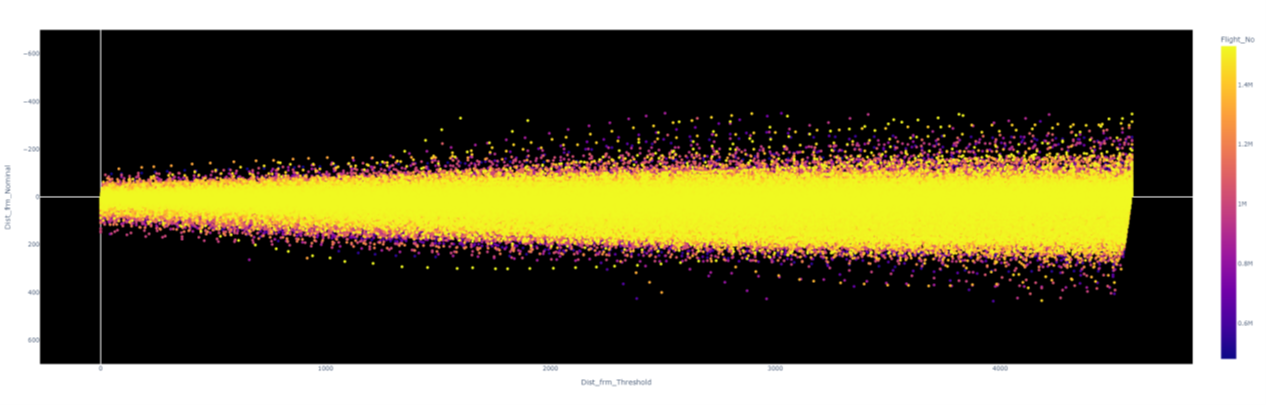
- The graph/plot above plots the Y-axis, Lateral Deviation in metres, against the X-axis which is the distance from threshold in metres.
- The graph above shows lateral deviation (Y-axis) where 0 is the nominal track, negative values show deviation to the east and positive values show deviation to the west.
- The plot shows that as the aircraft moves further away from the threshold the Lateral deviation increases, which is in line with previous assumptions.
- Significant number of flights closer to the nominal track, supported by descriptive statistics.
- Also possibly shows a preference for aircrafts to deviate to the west which is in the positive y-axis. This preference can be explained by the fact that in every SID involving the HORSH waypoint, the next waypoint is always towards the west. The flights with tracks veering off to the left and right are outlier flights that were not removed.
Normality tests concluded that our dataset was not normally distributed. However, as our sample size n = 28 176, is larger than n = 30 we can safely say our dataset is normally distributed due to the principles found in the central limit theorem[1].
Conclusions & Considerations
The result of our analysis confirms that 99.97% jet aircraft (given YMML’s runway 16 departure fleet mix) are able to accurately follow a predefined track to a waypoint to within ±126.09m, (±0.0681NM).
Based on the ~28,000 flights analysed, the average deviation from the track along the 5,000m to the fly-over waypoint was found to be 16.62m.
RNP 1 requires the aircraft be within 1NM 95% of the time, or as it says in the ICAO handbook “The accuracy requirement defines the 95% Total System Error (TSE)[1] for those dimensions where an accuracy requirement is specified”. As outlined above, the analysis showed that nearly 100% of aircraft (99.97%), had an average TSE of 0.00898 NM (16.62m) which is well below the 1NM guideline. This outlines the proficiency of the FMS to keep to a predefined track.
The statistical analysis tools used in this study can also be applied to other aspects of aviation, such as flight path optimisation and airport noise abatement procedures. This study is a testament to the power of data-driven decision-making in aviation and serves as an example of how real-world data can be used to improve the safety and efficiency of air transportation.
There are a couple factors that we must consider following our analysis. Firstly, is the accuracy of the ADS-B radar data (“normally accurate to less than 20m”[2]). The second consideration encompasses the significant figures in the Latitude and Longitude. Currently the analysis is accurate to 6 decimal places which results in an accuracy of .111m. The last consideration is that the data collection focuses on all flights departing from runway 16. If the analysis can target only aircraft following the SIDS the results will become even more accurate, e.g., data can be further refined by categorising and filtering the cancelled SIDS and visual departures out.
[1] The Central Limit Theorem states that the sampling distribution of the sample means approaches a normal distribution as the sample size gets larger — no matter what the shape of the population distribution. This fact holds especially true for sample sizes over 30. LINK
[2] Total system error (TSE).- The difference between the true position and the desired position. This error is equal to the sum of the vectors of the path definition error (PDE), the flight technical error (FTE), and the navigation system error (NSE).
[3] Source: Identification of ADS-B System Vulnerabilities and Threats

Isaac Warsame – Aviation Consultant
Isaac is an accomplished Aviation Consultant with To70 Aviation Australia, located in Melbourne, Victoria. As a data scientist at heart, Isaac is an expert in airside operations, airfield planning and optimization, and airfield noise and risk management. With a Master’s degree in data science, he skilfully employs his talents to analyse raw data and identify trends and patterns that provide invaluable insights into real-world issues. Isaac has a Bachelor’s degree in Applied Science (Aviation) and Business Management from RMIT University, which has equipped him with the expertise and knowledge required to be a leader in the cutting-edge field of Aviation Data Science.
Interested to know how Free Route performance can be measured as this is the next step in the Single European Sky as seen in FABEC
Good study Isaac, with a great deal of applicability to airport noise and flight path conformance monitoring.
Phil & Issac,
Aligns nicely with work we did 15 years ago to gain approval to introduce RNP 0.1 operations into Queenstown NZ. Lateral path never exceeded the wingspan of the A320, without checking I recall that the vertical error budget result was also really tight, as it needed to be.
Steve
An interesting study. I’d like to see a similar study undertaken to assess the variability in the track flown by differing aircraft types for a fly-by turn. When implementing PBN procedures, I’ve noticed quite a variance in where different types initiate the turn prior to the waypoint. A quantitive study to assess this variability would be useful.